Cool IoT Use Cases: Scanning technology gives event organisers real-time data on attendance and behaviour

![]() MARKET OVERVIEW: The annual UK “Bolton Food and Drink Festival” unites different flavours and tastes from all over the world. Attendance in 2017 was over 267,000.
MARKET OVERVIEW: The annual UK “Bolton Food and Drink Festival” unites different flavours and tastes from all over the world. Attendance in 2017 was over 267,000.
![]() THE PROBLEM: The organiser needed detailed, accurate, real-time data on visitors in order to study traffic flows and usage patterns such as individual routes between the festival and local transportation facilities and length of stay.
THE PROBLEM: The organiser needed detailed, accurate, real-time data on visitors in order to study traffic flows and usage patterns such as individual routes between the festival and local transportation facilities and length of stay.
![]() THE PLAYERS: Innotech Concepts was selected by the festival organisers to manage the project. The company specialises in transport, events and urban data collection with a focus on connectivity, public safety and evacuation. Libelium provided a smartphone detection scanner solution as well as its wireless sensor networking expertise.
THE PLAYERS: Innotech Concepts was selected by the festival organisers to manage the project. The company specialises in transport, events and urban data collection with a focus on connectivity, public safety and evacuation. Libelium provided a smartphone detection scanner solution as well as its wireless sensor networking expertise.
![]() THE SOLUTION: Two Libelium Meshlium Scanner units were installed at the main entrances of the fair and a third device was installed in one of the car parks and local transport parking zones. The detection scanner solution detects wireless devices using Bluetooth and Wi-Fi interfaces without the need to be connected to a specific access point. Devices are scanned every 15 minutes and the system scans individuals on entry and exit.
THE SOLUTION: Two Libelium Meshlium Scanner units were installed at the main entrances of the fair and a third device was installed in one of the car parks and local transport parking zones. The detection scanner solution detects wireless devices using Bluetooth and Wi-Fi interfaces without the need to be connected to a specific access point. Devices are scanned every 15 minutes and the system scans individuals on entry and exit.
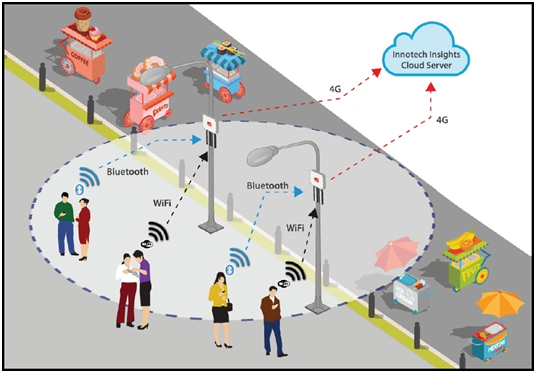
As shown in the schematic (source Libelium), anonymous data was securely sent via 4G to a proprietary analysis platform specially developed for modelling pedestrians called Innotech Insights Crowded™. The data is analysed and visual charts are provided alongside the raw data. Additionally, the platform provides a download option so that customers have access to the raw data set. This allows customers to perform their own calculations and it also shows that the technology and its analysis are transparent, open and honest.

The platform can process data from hundreds of projects anywhere in the world. It includes an automated analysis service that provides the end-user with accurate visualisations based on projected pedestrian movements.
THE BUSINESS BENEFITS: Attendance and behaviour data can be analysed in order to provide insightful information on:
- Duration of stay
- Visitor volume per location
- Visitor volume per day
- Most popular locations
- Most popular individual and group routes
- Total project visitors.
Comment on this article below or via Twitter @IoTGN

